
Introduction
XStat is an open-source real-time hardware monitoring application for Windows. It reads live sensor data from your CPU, GPU, RAM, storage and network then lets you design and display fully custom panels on your desktop — and on any device on your local network.
Download the NSIS installer, run it once with admin rights, and you're done.
Your sensor panel is also a LAN web page — view it on any phone, tablet, or second monitor.
Completely free and open source. Fork it, customise it, no strings attached.
System Requirements
| Requirement | Details |
|---|---|
| Operating System | Windows 10 (64-bit) or Windows 11 |
| Privileges | Administrator — required to read hardware sensor data via LibreHardwareMonitor |
| RAM | 200 MB minimum |
| Disk space | ~150 MB |
| Network | LAN only — no internet connection required |
Quick Start
The fastest way to get XStat running:
- Download the latest XStat Setup.exe from the Releases page.
- Run the installer as administrator.
- XStat starts automatically and appears in the system tray. Double-click the tray icon to open the main window.
Installer Recommended
The NSIS installer handles everything automatically — service registration, shortcuts, and startup entry.
1. Download
Go to the Releases page and download XStat Setup <version>.exe from the latest release.
2. Run the installer
Double-click the installer. Windows may show a SmartScreen warning — click "More info" → "Run anyway" (the app is not yet code-signed).
The installer will:
- Install XStat to
%ProgramFiles%\XStat - Register
XStatHardwareSvcas a Windows Service running as Local System - Create a Start Menu shortcut
- Add an optional Desktop shortcut
- Configure a Windows startup entry (can be disabled)
3. First launch
XStat starts automatically after installation. Look for the XStat icon in the system tray. Double-click it to open the main window.
Portable ZIP
No installer needed. Extract the portable ZIP anywhere and run XStat.exe directly.
- Download
XStat-Portable-<version>.zipfrom the Releases page. - Extract the ZIP to any folder.
- Right-click
XStat.exe→ Run as administrator.
From Source
Requires Node.js 20+, .NET 9 SDK, and Windows.
# Clone and install
git clone https://github.com/Inside4ndroid/XStat-Hardware-Monitoring.git
cd XStat-Hardware-Monitoring/src/app
npm install

# Start in dev mode (will prompt for elevation)
npm run dev:admin
See the Development Setup section for full details.
Firewall & LAN Access
The hardware service listens on port 9421 by default (configurable in Settings). If your Windows Firewall blocks LAN access to the web panel, add an inbound rule:
netsh advfirewall firewall add rule `
  name="XStat Hardware Service" `
  dir=in action=allow protocol=TCP localport=9421
Once the rule is in place, open the XStat app → Settings → scan the QR code or copy the URL to open the LAN panel on any device.
Uninstallation
- Installed via NSIS: Go to Settings → Apps (or Control Panel → Programs) and uninstall XStat. The Windows Service is removed automatically.
- Portable: Delete the folder. Any user config stored in
%APPDATA%\xstat\can also be removed manually.
Dashboard
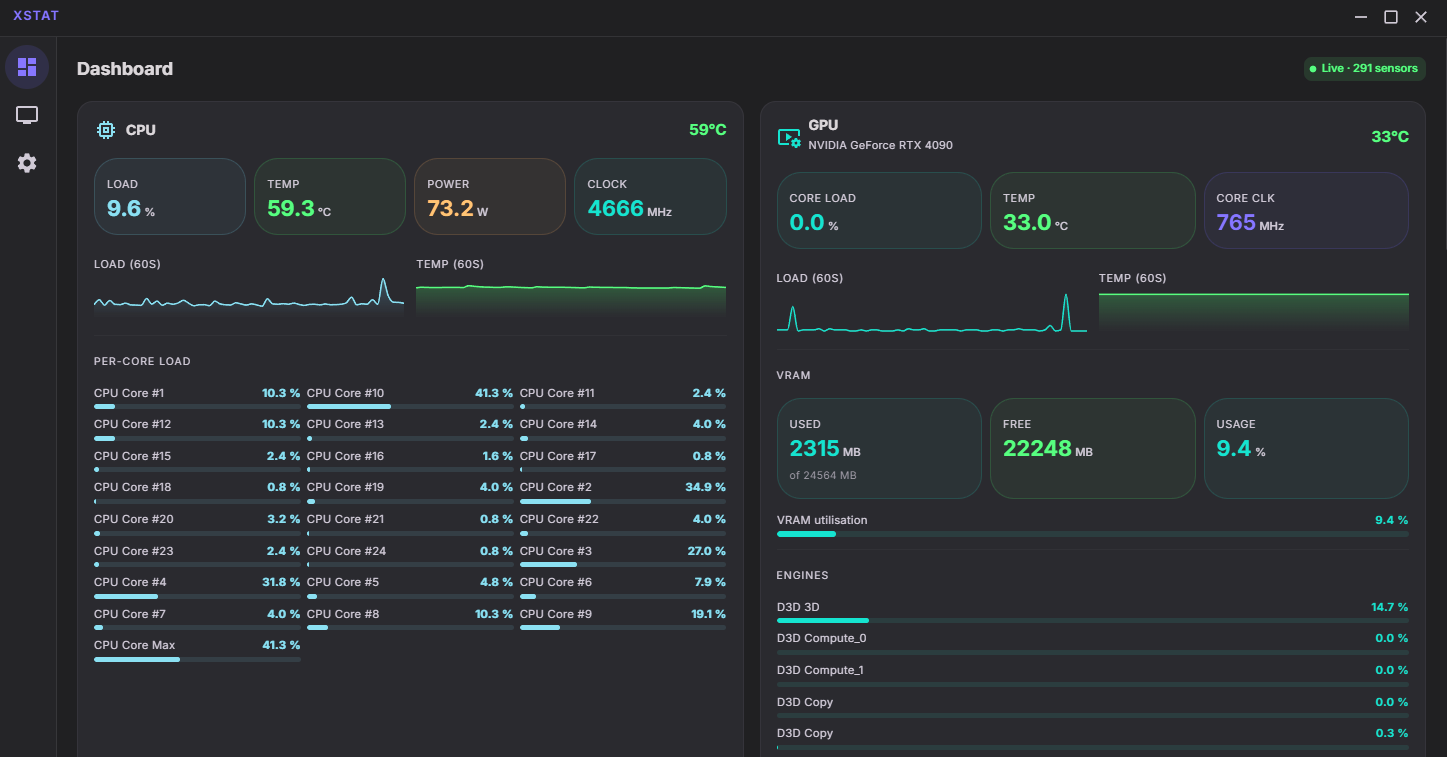
The Dashboard is the main view. It groups sensor data by hardware category and updates in real time via a SignalR WebSocket connection to the hardware service.
Sensor categories
| Category | Sensors shown |
|---|---|
| CPU | Load, temperature, power draw, clock speed, per-core load, sparkline history |
| GPU | Core load, temperature, VRAM used/free, engine utilisation, clock, sparkline history |
| RAM | Used, free, load percentage |
| Storage | Temperature, activity, transfer rates per drive |
| Network | Upload/download throughput per adapter |
| Motherboard | Fan speeds, voltages, chipset temperature |
Panel Editor
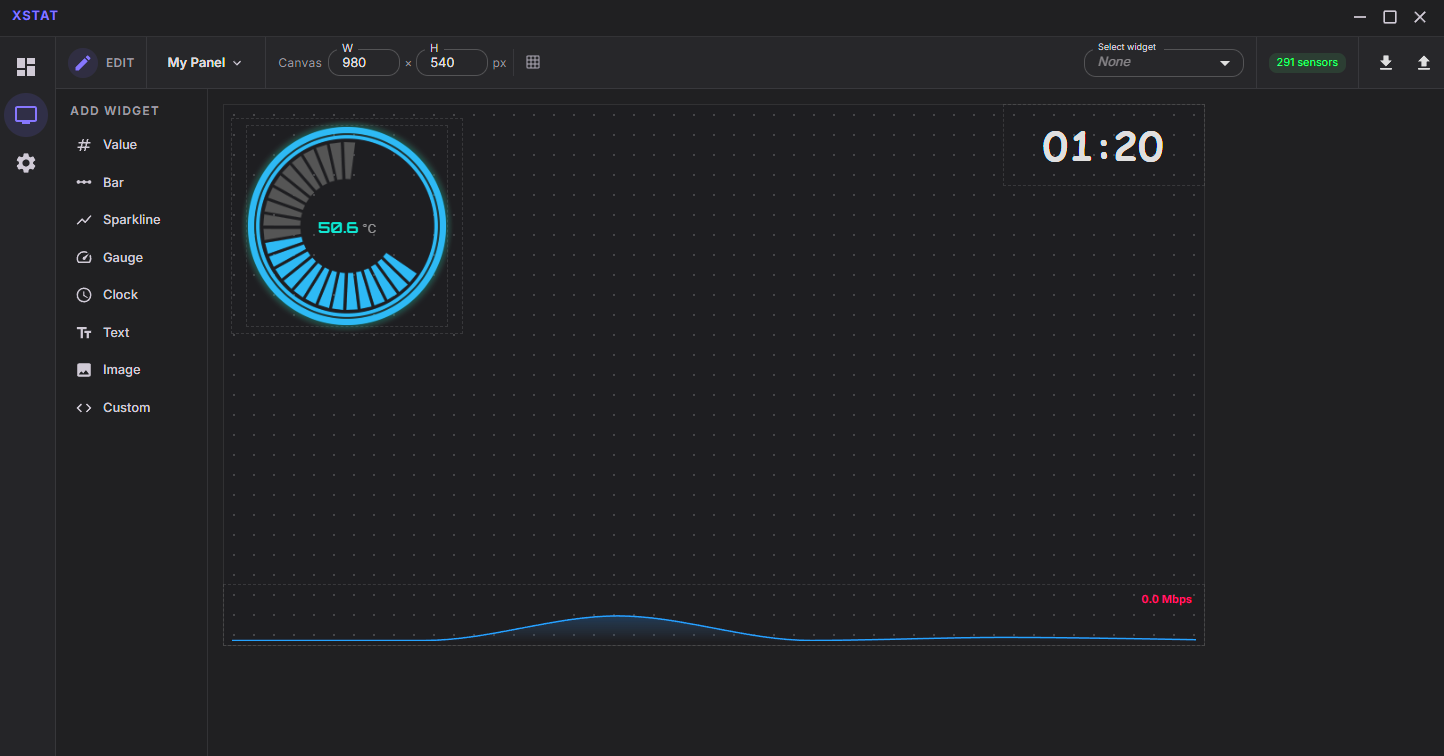
The Panel Editor lets you design a fully custom display panel using a drag-and-drop dot-grid canvas.
Basic workflow
- Click a widget type in the Add Widget sidebar to add it to the canvas.
- Drag to reposition; drag the resize handle to change size.
- Select a widget and use the Properties panel on the right to bind it to a sensor and style each element.
- Use the z-index controls (Send to Back / Bring to Front) to layer widgets.
- Click the panel name in the toolbar to rename it or switch between multiple panels.
- Use the Export / Import buttons to save or load panel layouts as JSON.
Canvas settings
The canvas size (W × H in pixels) determines the dimensions of your panel when viewed in the LAN browser. Set it to match your secondary monitor or streaming overlay resolution.
LAN Web Panel
Every panel you build is simultaneously served as a web page by the hardware service. Any device on the same network can view it in a browser — no app install required.
Finding the URL
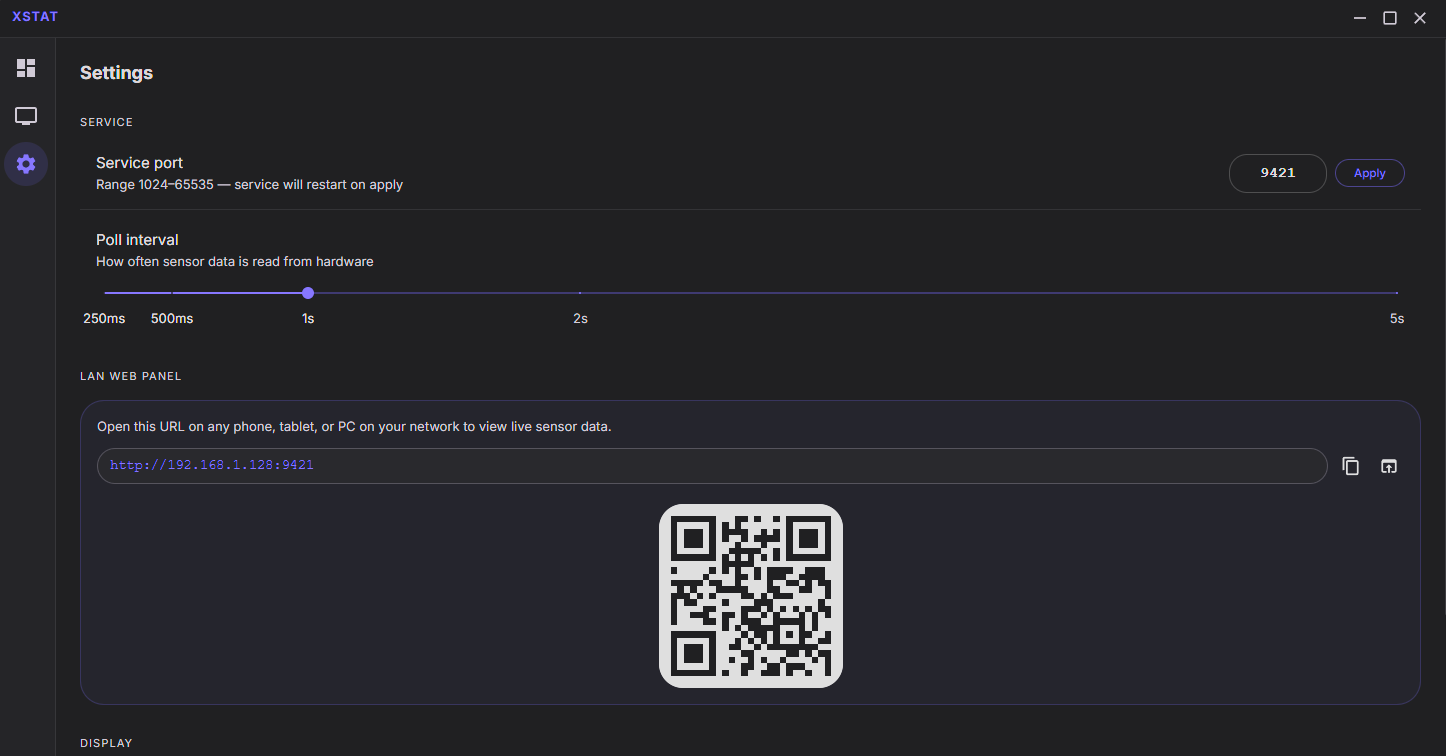
Go to Settings → LAN Web Panel. The URL (e.g. http://192.168.1.128:9421) and a QR code are shown. Scan the QR code with your phone or paste the URL into any browser.
Reconnection
The LAN panel automatically reconnects if the service restarts. If the panel is showing stale content, hard-refresh the browser (Ctrl+Shift+R).
Settings
| Setting | Description |
|---|---|
| Service port | The TCP port Kestrel listens on. Range 1024–65535. Click Apply to restart the service with the new port. Default: 9421. |
| Poll interval | How often LibreHardwareMonitor reads sensor values. Range 250 ms–5 s. Shorter = lower latency, higher CPU overhead. |
| LAN Web Panel URL | The local IP address and port to open the panel in a browser. Also shown as a QR code. |
| Start minimised to tray | Launch XStat minimised to the system tray instead of opening the main window. Toggle takes effect on the next launch. |
| Start with Windows | Add XStat to the Windows login items so it starts automatically when you sign in. Uses app.setLoginItemSettings in the production build. |
Settings are persisted to %APPDATA%\xstat\xstat-config.json.
Overview
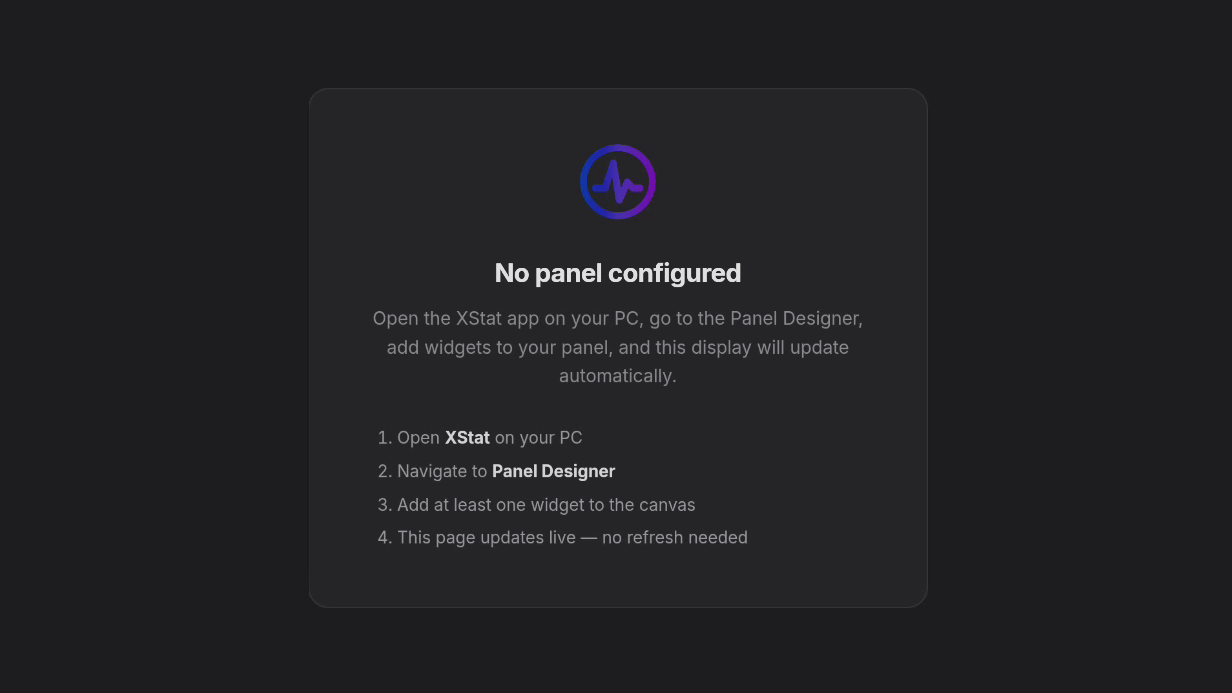
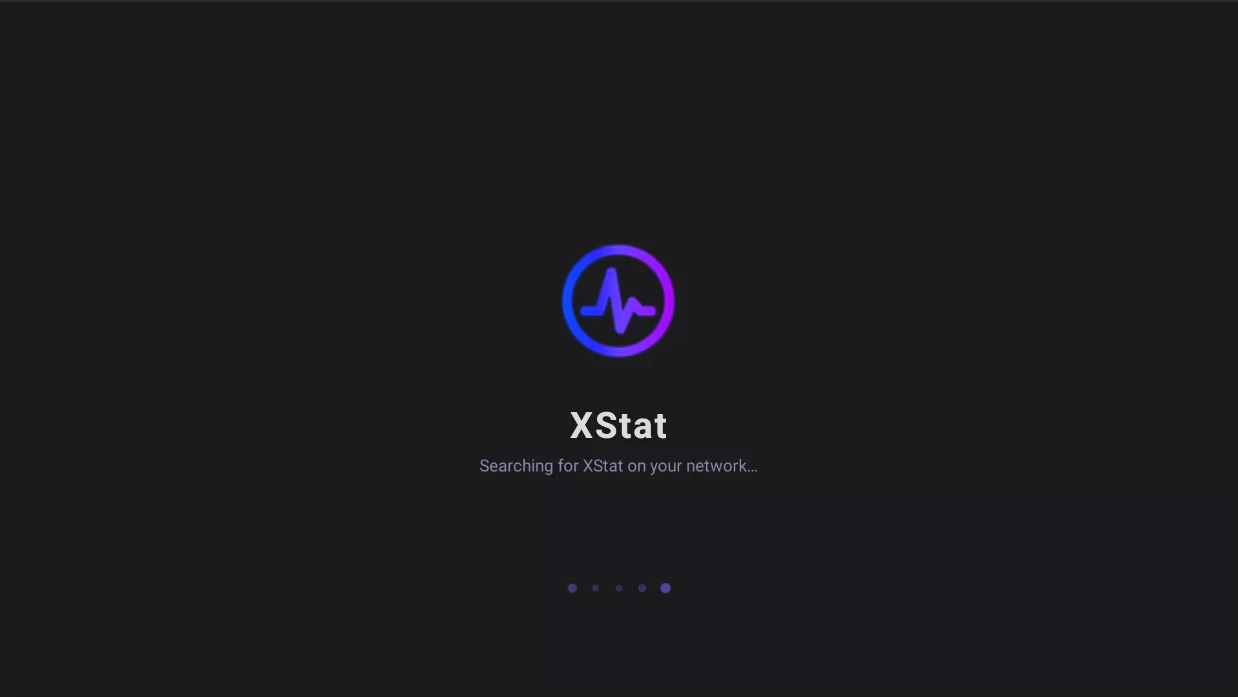
The XStat Android companion app automatically discovers your XStat PC on the local network using UDP broadcast and displays your custom sensor panel in a full-screen WebView. No IP addresses to configure.
Open the app and it finds XStat automatically. No IP addresses, no pairing.
Works on Android phones, tablets, and Android TV (tested on NVIDIA SHIELD).
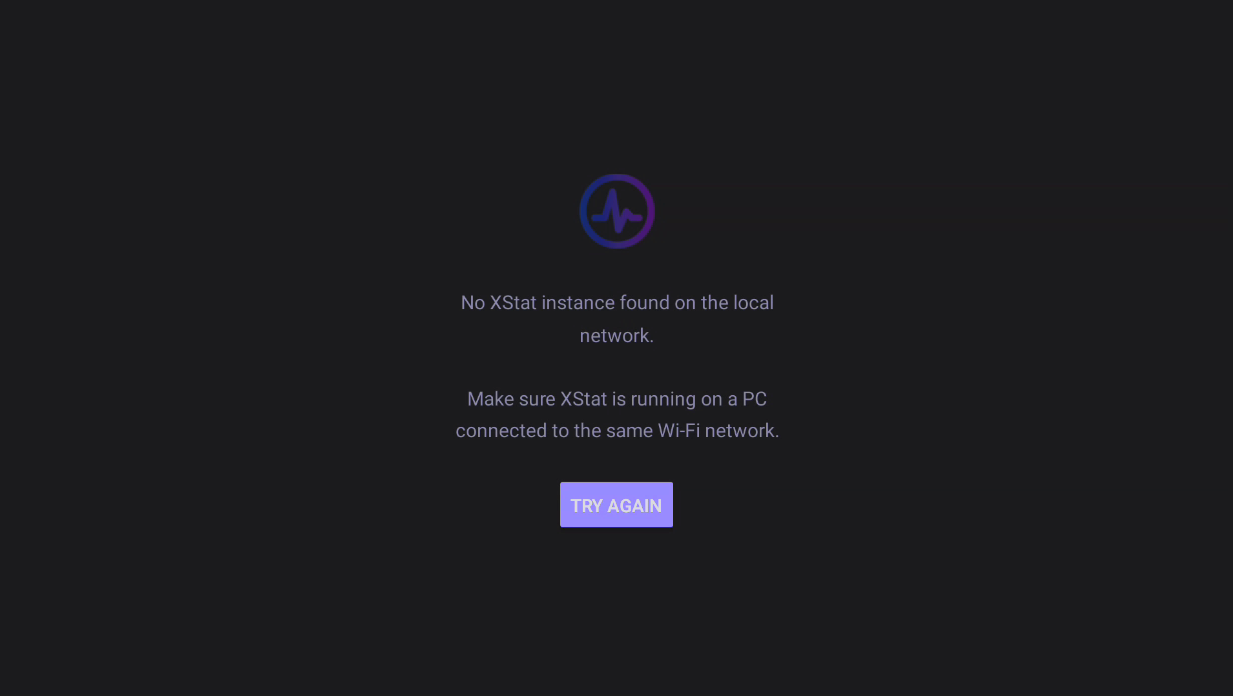
If the PC goes offline, the app detects it and returns to the discovery screen automatically.
Screenshots
Installing the APK
- Download
XStat-Companion-0.3.0.apkfrom the Releases page. - On your Android device, open Settings → Security (or Privacy on some devices) and enable Install unknown apps for your file manager or browser.
- Open the downloaded APK file and tap Install.
- Once installed, open XStat from your app drawer. Make sure your phone/tablet is on the same Wi-Fi network as your PC.
Android TV / SHIELD
Sideload the APK via ADB or a USB file manager. The app includes a TV-optimised leanback launcher entry and a 320×180 TV banner.
adb connect <shield-ip>:5555
adb install -r XStat-Companion-0.3.0.apk
adb shell am start -n net.xstat.companion/.SplashActivity
Auto-Discovery
XStat uses a UDP broadcast beacon to announce itself on the local network. The Android app listens for this beacon and connects automatically — no manual configuration required.
| Detail | Value |
|---|---|
| Protocol | UDP broadcast |
| Port | 47210 |
| Beacon payload | XSTAT_HERE:{port} |
| Broadcast interval | Every 2 seconds |
| Discovery timeout | 15 seconds |
The beacon is sent by the DiscoveryBeaconService background service running inside the .NET hardware service process on the PC. No additional firewall rules are required for UDP broadcast within the same subnet.
Connection health monitoring
Once connected, the app pings /health on the XStat service every 5 seconds. After 3 consecutive failures (15 seconds total) it concludes the host is offline and returns to the discovery splash screen to search again.
Android TV
The companion app fully supports Android TV. It ships with a 320×180 TV banner and registers a leanback launcher entry so it appears in your TV's app grid.
| Feature | Detail |
|---|---|
| TV banner | 320×180 px — shown in the Android TV launcher |
| Leanback support | Registered via CATEGORY_LEANBACK_LAUNCHER |
| Tested on | NVIDIA SHIELD Android TV (Android 11, SDK 30) |
| Min SDK | 21 (Android 5.0 Lollipop) |
| Target SDK | 35 |
The app runs in full-screen immersive mode with no navigation bars or status bar. On TV remote, the Back button is intercepted for WebView history navigation before exiting.
Common Properties
Every widget in the panel editor shares these base properties:
| Property | Type | Description |
|---|---|---|
id | string | Auto-generated unique identifier |
type | WidgetType | One of the eight widget types listed below |
widgetName | string? | User-defined name shown in the widget selector dropdown |
zIndex | number? | Layer order — higher values appear on top. Default: 0 |
x, y | number | Grid position (column / row) |
w, h | number | Grid size in grid units |
Sensor Value
Displays a single sensor reading as a large number with an optional label and unit. Best for spotlighting a single metric at a glance.
Best for: CPU temperature, GPU load, RAM usage, fan speeds.
| Property | Description |
|---|---|
sensorId | Sensor to bind the value to |
label | Override the sensor's default label text |
unit | Override the sensor's default unit text |
color | Value text colour |
fontSize | Value font size (px) |
labelColor, labelFontSize | Label styling |
unitColor, unitFontSize | Unit styling |
showLabel / showValue / showUnit | Toggle each element on/off |
Sensor Bar
A horizontal progress bar showing a sensor value against a configurable min/max range. Good for load percentages.
| Property | Description |
|---|---|
sensorId | Sensor to bind |
min / max | Value range for the bar fill. Default: 0 / 100 |
barColor | Fill colour |
trackColor | Background track colour |
showLabel / showValue | Toggle label and value text |
Sparkline
An area chart displaying the last 60 data points for a sensor. Great for spotting trends and load spikes over time.
| Property | Description |
|---|---|
sensorId | Sensor to chart |
lineColor | Chart line and area fill colour |
showLabel | Toggle the sensor label |
showValue | Toggle the live value overlay |
Gauge
A circular arc gauge with a coloured fill over a subtle track. Clean and compact for percentage-based metrics.
| Property | Description |
|---|---|
sensorId | Sensor to bind |
min / max | Gauge range. Default: 0 / 100 |
gaugeColor | Arc fill colour |
showValue | Toggle the centre value label |
Clock
Displays the current local time, updating every second. Supports configurable format, font, and colour.
| Property | Description |
|---|---|
format | HH:mm (24-hour) or hh:mm a (12-hour). Default: HH:mm |
color | Text colour |
fontSize | Font size (px) |
fontWeight | Font weight (e.g. 400, 700) |
Text
A static text label. Use it for section headings, decorative text, or anything static on your panel.
| Property | Description |
|---|---|
text | The text content to display |
color | Text colour |
fontSize | Font size (px) |
fontWeight | Font weight |
italic | Italic style toggle |
Image
Display any image on your panel. Use it for a logo, background, watermark, or decorative graphic.
| Property | Description |
|---|---|
src | Uploaded image (stored as base64 data URL) |
objectFit | contain, cover, or fill |
opacity | 0–1, default 1 |
Custom HTML Widget
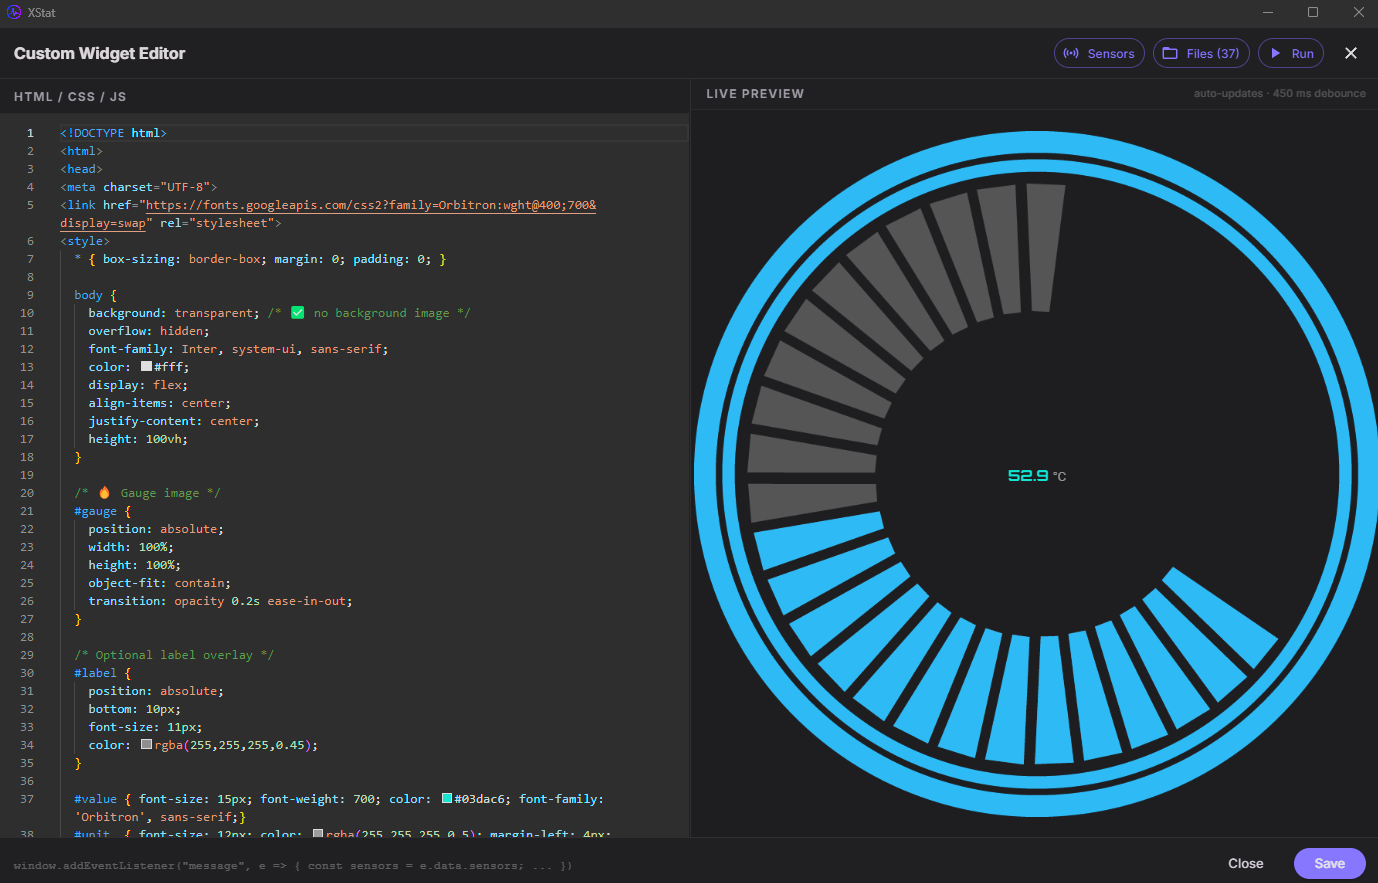
Write completely bespoke widgets using HTML, CSS, and JavaScript in the built-in Monaco editor. Live preview updates as you type. Sensor data is injected via a postMessage API.
Sensor data API
The widget iframe receives a message event whenever sensor data updates. Listen for it like this:
window.addEventListener('message', (e) => {
  const sensors = e.data.sensors; // HardwareSnapshot object
  // Access any sensor value, e.g.:
  const cpuTemp = sensors?.cpu?.temperature;
});
Files panel
The Files (N) button in the editor toolbar lets you upload assets (images, fonts, data files) that are bundled with the widget. Reference them by filename in your HTML.
Tips
- Set
background: transparenton the body to blend with the panel background. - Use
overflow: hiddento prevent content from spilling outside the widget bounds. - The live preview reflects the last saved sensor snapshot — click Run to force a refresh.
Prerequisites
| Tool | Minimum version | Notes |
|---|---|---|
| Windows | 10 / 11 | Required — hardware sensor access is Windows-only |
| Node.js | 20 LTS | nodejs.org |
| .NET SDK | 9.0 | dotnet.microsoft.com |
| Git | Any recent | |
| Administrator rights | — | The hardware service must run elevated to read sensor data |
Dev Setup
1 — Clone & install
git clone https://github.com/Inside4ndroid/XStat-Hardware-Monitoring.git
cd XStat-Hardware-Monitoring/src/app
npm install
2 — Start the dev server
The dev:admin script launches the Vite dev server and the Electron shell together, prompting for administrator elevation so the hardware service can access sensors.
npm run dev:adminThis runs dev-admin.ps1 which:
- Re-launches the PowerShell session elevated (UAC prompt).
- Starts the .NET hardware service in the background.
- Runs
electron-vite dev— the React Vite HMR server and Electron window.
3 — Rebuild the LAN panel
When you change panel-related React code and want the LAN panel to reflect it, rebuild the panel bundle:
npm run build:panelProject Layout
xstat/
├── src/
│   ├── app/                    # Electron + React frontend
│   │   ├── electron/
│   │   │   ├── main.ts         # Main process
│   │   │   └── preload.ts      # Context bridge
│   │   └── src/
│   │       ├── pages/          # Dashboard, PanelEditor, Settings, WidgetEditor
│   │       ├── components/     # Shared UI components
│   │       ├── hooks/          # useSensors, usePanelLayout, useAppSettings
│   │       └── types/          # TypeScript definitions
│   └── XStat.Service/          # ASP.NET Core hardware service
│       ├── Controllers/        # REST API
│       ├── Hardware/           # LibreHardwareMonitor wrapper
│       ├── Hubs/               # SignalR sensor hub
│       └── Services/           # SensorBroadcastService
├── website-source/             # This website (GitHub Pages)
├── build.ps1                   # Full production build script
└── xstat.sln                   # Visual Studio solution
Production Build
Run the build script from the repo root. It publishes the .NET service, builds the React bundles, and packages the Electron app into an NSIS installer and a portable ZIP.
.\build.ps1Output artifacts are placed in dist\:
XStat Setup <version>.exe— NSIS installerXStat-Portable-<version>.zip— portable buildwin-unpacked\— unpacked app directory
Overview
XStat is composed of two independent processes that communicate over HTTP and WebSockets.
- Window management
- Service spawn
- Port config
- System tray
- Dashboard
- Panel Editor
- Settings
- Widget Editor
http://192.168.x.x:9421Electron Process
Main process (main.ts)
- Service lifecycle — probes
/health, tries to start the registered Windows Service, falls back to spawning the.exedirectly. - Window management — main window (custom frame) and a detached widget editor window.
- IPC handlers — exposes
service:url,service:setPort,window:*,app:quit, andwidget-editor:*channels. - System tray — closing the main window hides it to the tray rather than quitting.
Preload (preload.ts)
Bridges main process to renderer via contextBridge.exposeInMainWorld('xstat', ...). The renderer has no direct Node access — all native operations go through the typed window.xstat API.
Hardware Service
An ASP.NET Core 9 web application that wraps LibreHardwareMonitor and exposes sensor data over HTTP and WebSockets.
- Listens on
0.0.0.0:{port}— required for LAN browser access. - Supports running as a Windows Service (
UseWindowsService) or as a console app. SensorBroadcastServicepolls hardware at the configured interval and sends snapshots to all SignalR clients.- Serves the panel React bundle as static files from
wwwroot/.
REST API
| Endpoint | Method | Description |
|---|---|---|
/health | GET | Liveness probe; returns {"isAdmin": true} |
/api/sensors | GET | One-shot sensor snapshot (JSON) |
/api/panels | GET / PUT | Panel layout read/write (file-backed JSON) |
/api/config | PUT | Update poll interval at runtime |
/hubs/sensors | WebSocket | SignalR hub — subscribe to live SensorUpdate events |
Data Flow
LibreHardwareMonitor
        │  poll every N ms
        ▼
SensorBroadcastService
        │  SignalR broadcast
    ┌───┴──────────────────────┐
    ▼                          ▼
Electron Renderer          LAN Browser
(useSensors hook)          (PanelApp.tsx)
        │                      │
   HardwareSnapshot       HardwareSnapshot
        │                      │
  Widget renderers        Widget renderers
        │                      │
  Live panel display      Live panel display
Security Notes
0.0.0.0) intentionally — this is required for LAN panel access. Only expose XStat on a trusted local network.- CORS is restricted to
localhost, Electron (file://), and private IP ranges only. - No authentication is implemented on the service endpoints.
- The Electron renderer runs with
contextIsolation: trueandnodeIntegration: false. All Node access is via the typed preload bridge.